Product Science
Preface
I’m interested in the tools that technology startups use to build, and measure the success of, products. This covers the most interesting points that I’ve come across from reading everything I can find about product management and experimentation within the product development cycle.
Growth
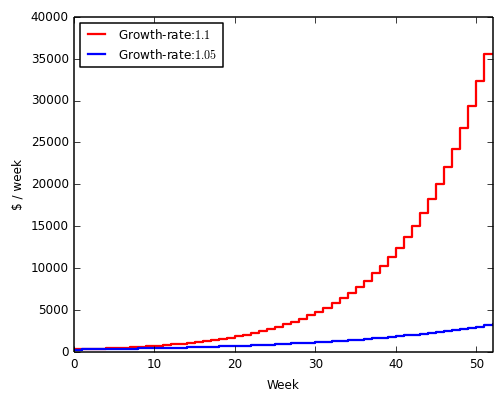
What defines a technology startup? Paul Graham defines a startup as a company designed to grow fast. Growth distinguishes startups from the millions of local service businesses launched every year. Startups typically aim for growth that is proportional to their current size: a fixed percentage of new users added per week will lead to a non-linear explosion in total user count over time.
Why is growth important?
Consider two companies growing with a two-fold difference in rate. After one year, the first startup has passed the knee of its exponential and the difference in revenue is more than 10-fold. Many iconic startups have enjoyed this run-away growth due to a network effect. Consider OpenTable, an online restaurant reservation marketplace. As more restaurants entered the system, more diners followed. This attracted more restaurants, fueling a flywheel that has given OpenTable over 90% market share.
Growth parameters
Market size
Growth runs up against bounds. Consider Facebook’s growth (data from Ben Foster's blog). A trivial upper-bound is the world population. But, it’s more interesting to consider psychological bounds. As explained by Alex Schultz, Facebook hit a wall ~50M users (dashed line).
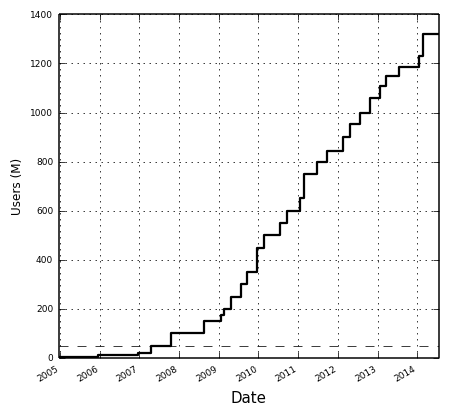
At the time, no social network had surpassed 100M users. Some doubted whether it was possible. Of course, they did it. Chamath has a good talk about what it took to get past this barrier. The point is that growth bounds exist, but they are not always obvious to identify.
Acquisition
Feedback is critical for fast growth: the number of new users should be proportional to the existing user base. Viral marketing math captures this feedback in a loop that links existing users to new user acquisition. The viral loop can explain the hyper-growth observed for some startups.
For example, Peter Theil noted that Paypal had 7% daily growth at one point. This growth loop began with power sellers and buyers who executed many transactions per unit time. With cash incentives, Paypal also had a high conversion rate among those exposed to the product through power users.
Retention
Acquisition and retention are independent parameters in the growth model. This is key. Alex Schultz explains how retention curves are used for modeling this. A retention curve captures the degradation rate in monthly active users following acquisition. In the worst cast, it flattens out to zero.
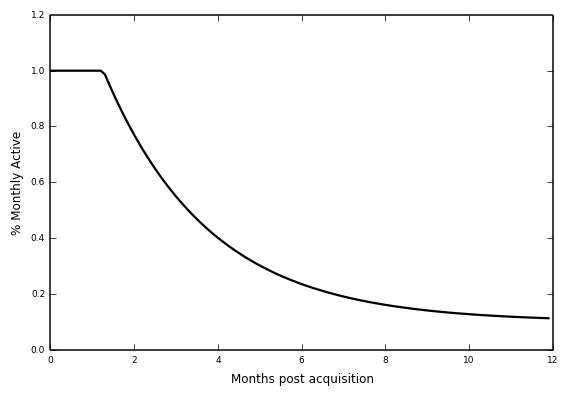
I simulated a few scenarios to convince myself (I will link to iPython notebook). At best, growth is stifled when users churn. At worst, growth crashes out to zero. The intuition is pretty clear. Leaky buckets don’t need water. They need to be patched. Viral acquisition with a bad product will hemorrhage users.
Metrics
These growth parameters are often broken into more granular metrics. There are some heuristics for picking metrics (e.g., they should be MMOM - Meaningful, Measurable, Operational, and Motivational). Two general metric classes appear frequently in everything I've read:
- Engagement metrics: These are ratios such as monthly active users (MAU)/total or DAU/MAU.
- Conversion: Users that perform a desired action divided by the total.
Product and growth
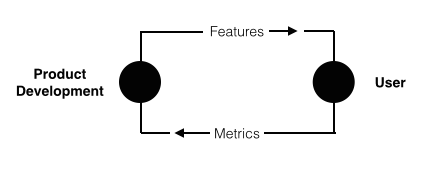
After reading everything I could find about growth, a key point emerged: product is the lever that moves the metrics. Product is a free parameter that a startup can play with in order to drive growth. With that in mind, it's interesting to understand the process that startups use to build products.
This brought me to some great writing on product management. Adam Nash, CEO at Wealthfront, distills lessons on product leadership, which I further compress into picking a metric, developing a hypothesis, prioritizing features based upon the hypothesis, executing, and measuring success.
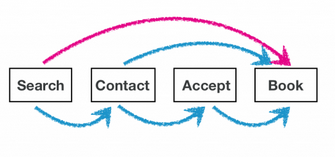
Good product teams seem effective at boiling a product down to the one thing they want the user to do and finding the one metric that matters for success. For example, the success metric at AirBnB is the overall conversion rate between searching and booking.
With a metric, how to develop a thesis and product plan? Amazon does this by working backwards from the customer. They write the press release prior to starting any product development. Adam Nash and Ian McAllister also have some good writing product feature types and prioritization strategy.
I found this process surprisingly familiar: (1) Spend time thinking through the thesis on the front-end of a project, (2) don't rely on costly experiments to lead the way, (3) pick the minimum number of experiments and simple analyses to test your thesis, (4) build re-useable analysis pipelines.
Feedback is especially important. In the sciences, iteration and learning across projects leads to what they call a taste for good problems. This is analogous to good product management instincts or "spidey sense". So, what are the experimental learning systems built around the product cycle? And are they needed? Is the coupling between product/features and metrics just obvious?
Experimental Schema and Design
There are at least two important considerations for experimental design.
External factors
A key challenge is that the feedback loop between product/features and the metrics is not always obvious. The outside world has an effect on metrics! Controlled experiments can be used to isolate the effects of a features on a metric from all of the external factors that could also influence the metric.
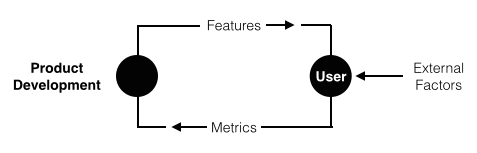
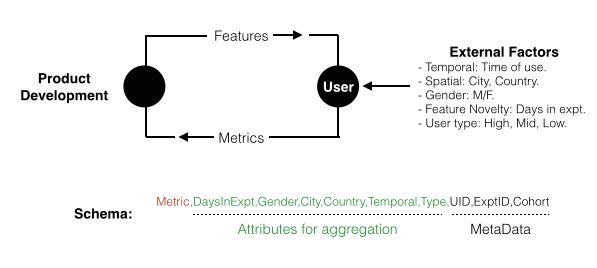
In addition to the metric of interest, external factors should also be logged in a controlled experiment. With this schema captured, users in both test (subject to a feature change) and control cohorts can be aggregated by these attributes to isolate effects of the feature change from the external factors.
The funnel
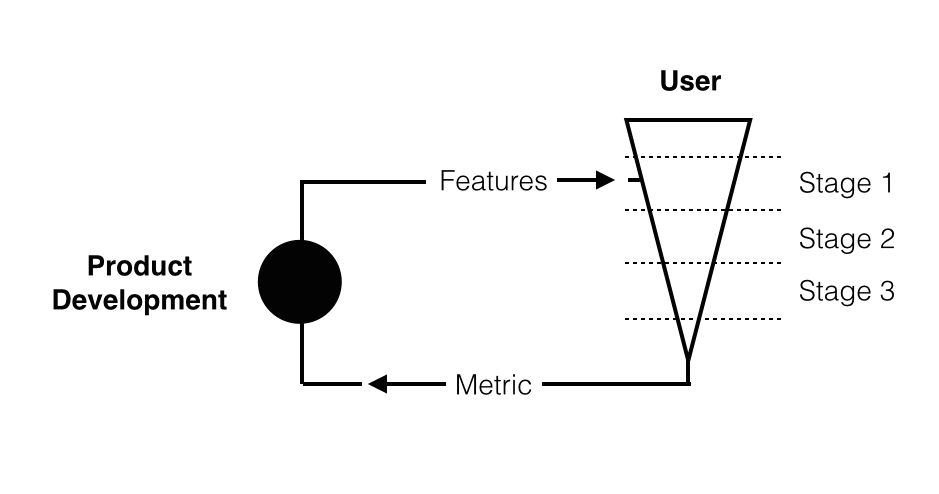
It's also critical to consider the funnel to conversion. Each step may introduce frictions that affect the metric! Jan Overgoor, a data scientist at AirBnB, has a great blog post that discusses this: in addition to capturing external factors, experiments can be partitioned by specific steps in the funnel.
Dan McKinley, an Engineering at Etsy and now Stripe, has a great talk on product design for continuous experimentation that extends this point: it's hard to interpret experiments if (1) many feature changes are made simultaneously or (2) if a feature change affects many parts of the funnel simultaneously.
He talks about a failed experiment at Etsy: it involved a "monolithic" roll-out of a new features (the infinite scroll that automates loading of new items). This lead to fewer impressions and fewer purchases. When the feature failed, de-bugging was challenging because so much had been changed at once.
A set of smaller, carefully designed experiments showed that the basic premises (e.g., more and faster results are good) were wrong. He goes on to discuss to discuss a more successful product launch: staged experiments gave them clear opportunity to test each hypotheses and, if needed, alter course.
Instrumentation
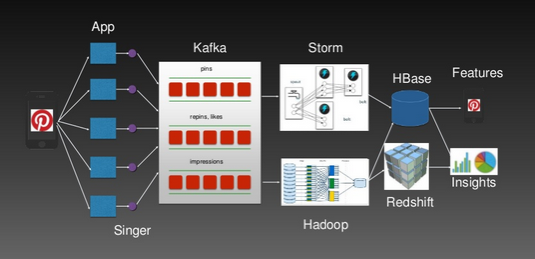
With that in mind, how are experiments done? Logs are the substrate of experiments. They capture information specified by the schema. For example, this blog post from Pinterest nicely explains how the schema is captured in different log files and later aggregated accordingly.
Logs are so central that Jay Kreps, data scientist / engineering at LinkedIN (now CEO at Confluent), has an excellent post about the log and pipelines to process them.
Data pipelines have producers and consumers. Producers write logs that may contain web events or physical data (e.g., RFID and IoT). Consumers process the logs. But because event data can be orders of magnitude larger than traditional database uses, the structure of data pipelines can be complex.
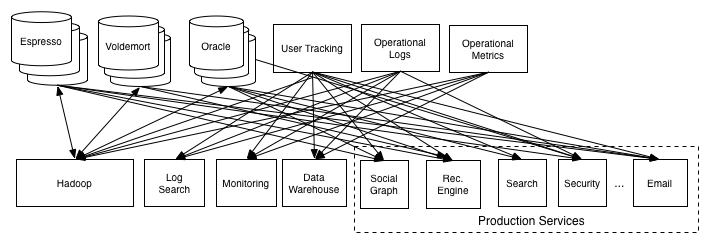
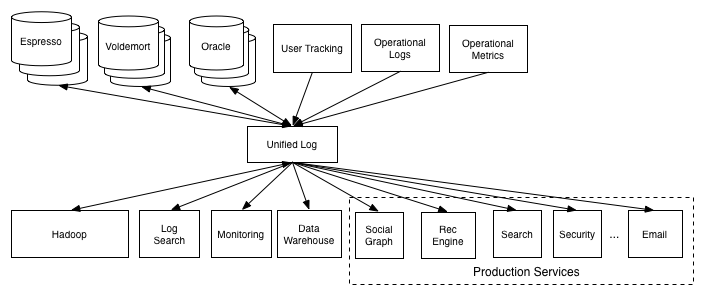
To address this, Jay and colleagues developed a central log that (1) is as a buffer between producers and consumers, (2) allows for subscription by systems (e.g., Hadoop) that consume data at different rates, and (3) allows new data systems to connect to all others with a single pipeline.
The outputs from the central log are then suitable for batch ETL into systems that allow analysis: system-specific non-sense is removed and the data is restructured for for warehousing (e.g., STAR schema) and admits to experimental analysis (simple counting, aggregation, and filtering).
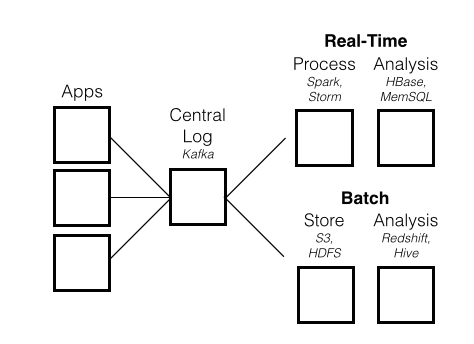
Logging agents, such as Singer, sit on application servers. They collect event logs and ship them to a centralized repository. The centralized repository, such as Kafka, consumes events and moves them to subscribers. Kafka powers event stream pipeline for many companies.
For batch processing, storage systems like HDFS, HBase, and S3 can be tied to relational databases such as Hive, which provides scalable SQL-like functionality on top of a Hadoop cluster, and Redshift, a SQL database on S3 that can have better performance than Hive).
For real-time processing, steam data processing services like Storm or Spark streaming are comparable and may connect to real-time data storage, such as HBase, a NoSQL key-value store, or MemSQL for real-time databases for transactions and analytics.
For process coordination, Mesos joins multiple physical resources into a single virtual resource. It schedules CPU and memory resources across the cluster using Zookeeper, a configuration manager. Frameworks, such as Hadoop, manage applications on Mesos.
Pipelines
These building blocks for experimental pipelines are largely open-source and un-bundled into a collection of services. Companies can mix and match them in different ways. For example, Pinterest has a nice overview of their experimental A/B test pipeline that merges different log types to group metrics per experimental group, segmentation (e.g., gender), and days-in the experiment.
The scale of the data (20TB of experiment metric data every six months) requires a large-scale system (HBase) for batch processing. The HBase keys contain the schema needed to perform the required segmentation and different metrics are just captured in different column families.
Batch processing on the data in HBase is done daily and results are pushed to Dashboards for visualization. In order to improve the success rate of experiments, they also have a real-time pipelines (with Storm and Spark) that can perform operations as the experiment is running.
Controlled Expariments
Once we've designed an experiment, split into test and control cohorts, and captured logs with our metrics / schema using instrumentation described above, we need a testing framework to rigorously evaluate whether there is a difference in the metric between the two.
It's worth noting that many metrics are binary: a user did something or they didn't. So, statistical tests for binary data (Chi-Squared, Z-test, or N-1 Chi-Squared test) are common in A/B testing frameworks. These tests assume a null-hypothesis (no difference between cohorts) and compute the probability of observing the observed effect assuming the null-hypothesis is true (a p-value).
But, P-values are poorly understood. They are a function of sample size and effect size. Jan Overgoor shows this nicely. They ran a test that computes a rolling P-value (bottom) for the treatment effect (top). Large effects randomly observed early on are called significant given the p-value cutoff of 0.05. But the sample size is small in these early timepoints. Over time, the effect converges to zero!
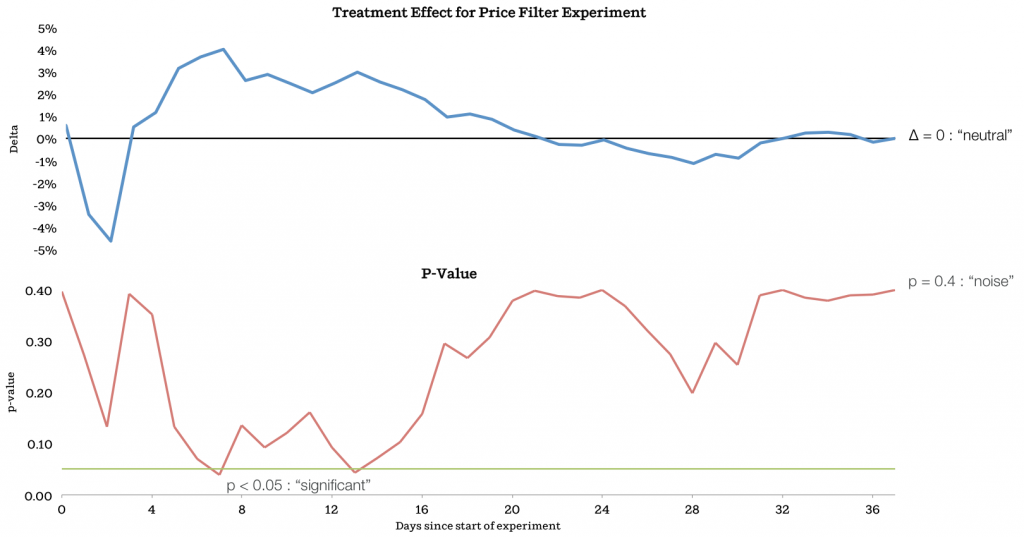
Tests can fail by identifying false positives (above, Type I error) or false negative (Type II error). But, there's a few free parameters to combat these, such as Power (probability that you will avoid Type II errors), sample size, expected effect size, and p-value threshold.
The ideal approach is to pre-determine the expected effect size, desired power, and P-value threshold prior to the experiment. If we fix power (0.8) and p-value threshold (0.05), then we can sweep across a range of effect sizes to compute required sample sizes (e.g., via calculators).
Given an expected effect size, we can also compute a binomial parameter, which indicates the probability of conversion for each cohort. We can simply compare computed parameters (with confidence intervals) between cohorts in order to test the difference.
Using data provided by Jason Davis, a software/data engineer Etsy, I ran a simulation below: given an expected effective size for a new feature (conversion goes from 2% to 2.04%) and user enrollment of 500k per day, the time needed to see the effect is 7 days (> 3.5M visits).
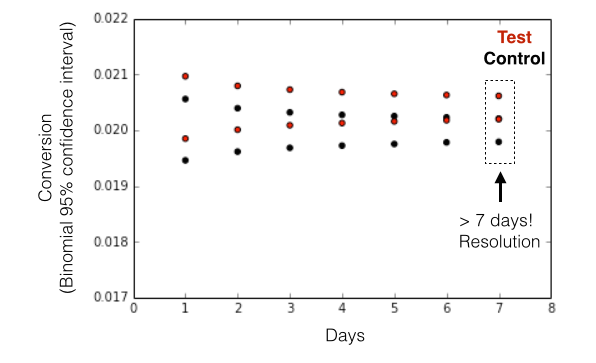
An intuitive and inverse relationship between effect size and sample size falls out: you need more data to observe subtle effects! And for cases in which the effect size is unknown, Jan mentions how dynamic (in time) p-value thresholds can be to determine whether or not an early result is worth investigating.
Framework for Controlled Experiments
(1) "Free experiments" to develop ideas
My favorite kind of experiments are the ones that cost nothing: quick data mining at the experimental design phase can clarify the hypothesis! For example, if we want to build a feature to reduce churn, we might be challenged by the fact that there are many things that may influence the metric.
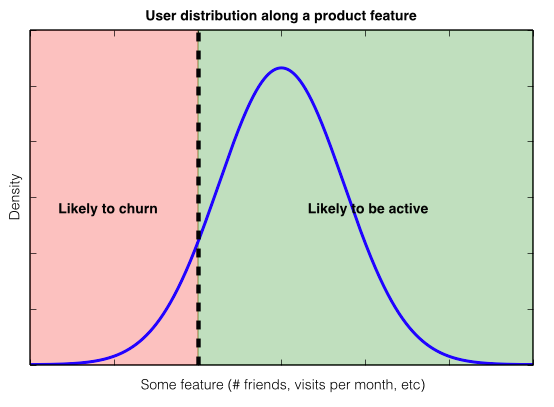
Examining existing historical data may be one way to suss this out and improve clarity. And clarity seems common to most successful product and growth teams. For Facebook, the key metric to avoid churn was friend count; Zuck talks about getting people to 10 friends in 14 days. Josh Elman, product lead for growth at Twitter, explains that they focused on visits, with 7 times per month the threshold.
Once a team understands the product feature that strongly separates users based upon a key metric, then controlled experiments (as explained above) can be centered around this core insight.
(2) Experimental Design
- Define the metric.
- Define the (product/feature) hypothesis.
- Define schema to capture metric and confouding factors.
- Stage expariments based upon the conversion funnel.
(3) Instrumentation
- Design the simplest possible instrumentation scheme.
- Make it re-usable so that it can be applied to many expariments.
(4) Data collection, analysis, and reporting
- In order to isolate feature effects, group on schema attributes.
- Ensure grouped samples are large enough to resolve the effect size.
- If computing a rolling P-value, use dynamic cutoffs.
- Also consider regression (generalized linear models) to avoid data slicing.
- Build intuitive reporting dashboards and visualizations
Final Comments
Controlled experiments have been used for centuries to better understand the physical world. But they have been largely directed at "model systems," which can be easily manipulated. For larger-scale phenomena, controlled experiments have been very hard to do. Scientists have relied on (econometric) frameworks (e.g., difference in differences) to approximate controlled experiments in these cases.
The advent of the web made it possible to conduct massive controlled experiments to improve virtual experiences. The injection of software into many verticals means that it's possible to build learning loops that improve product and user experiences across a broader array of virtual activities.
Mobile extended the reach of the web. Full-stack startups built on top of mobile inject software deep into the physical world. For the first time, it's possible to run massive controlled experiments to improve physical experiences, not just virtual. Companies like Uber have proven that focus on product can vastly grow markets for physical services and, at the same time, alter the flow of cities.
Product science on top of this can of course optimize existing services (such as POOL) that benefit consumers and also have positive effects on cities. But, the digital grid also gives Uber the ability to experiment with new experiences in the physical world. They've reported experimentation with services randing from on-demand flu shots to weddings and logistics. Overlaying a digital grid on physical experinces make companies like Uber unprecedented experimental machines.
Note
I'm doing a PhD at Stanford and have no affiliation with any companies mentioned in this article.