San Francisco's Drug Geography
I recently grabbed all crime data captured by the SFPD Crime Incident Reporting system, which is available through SF open data. It has ~1.7 million records from the past 12 years with a temporal and spatial stamp on each one. I've been interested in digging into some GIS data, so this is awesome!
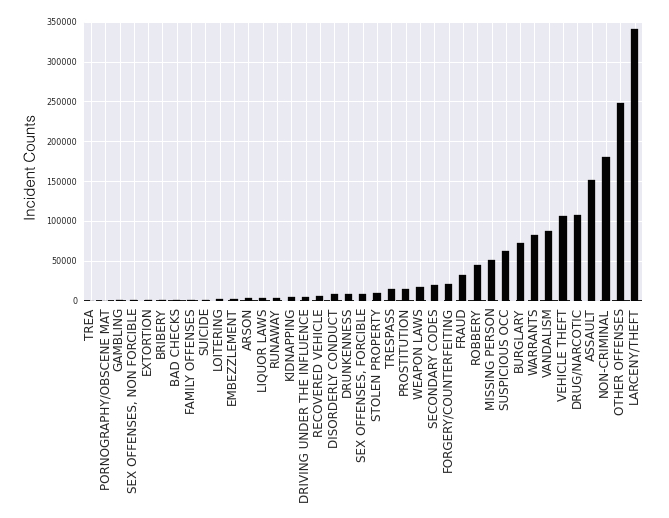
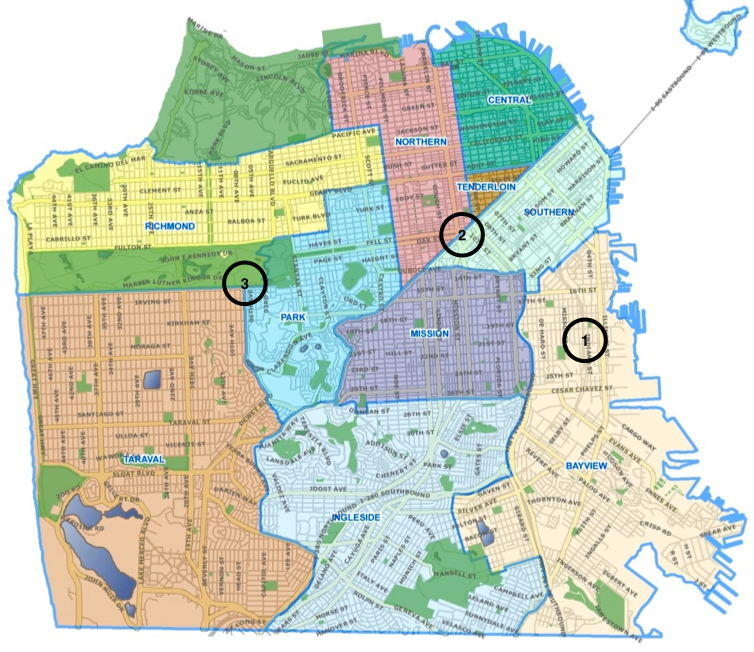
SF is broken up into 10 police districts. Each record in the data is associated with a district as well as a specific crime category. I show the counts across the general crime categories below and used iPython notebook (linked here), Seaborn, and pandas for the work. Welcome others to view or pull it.
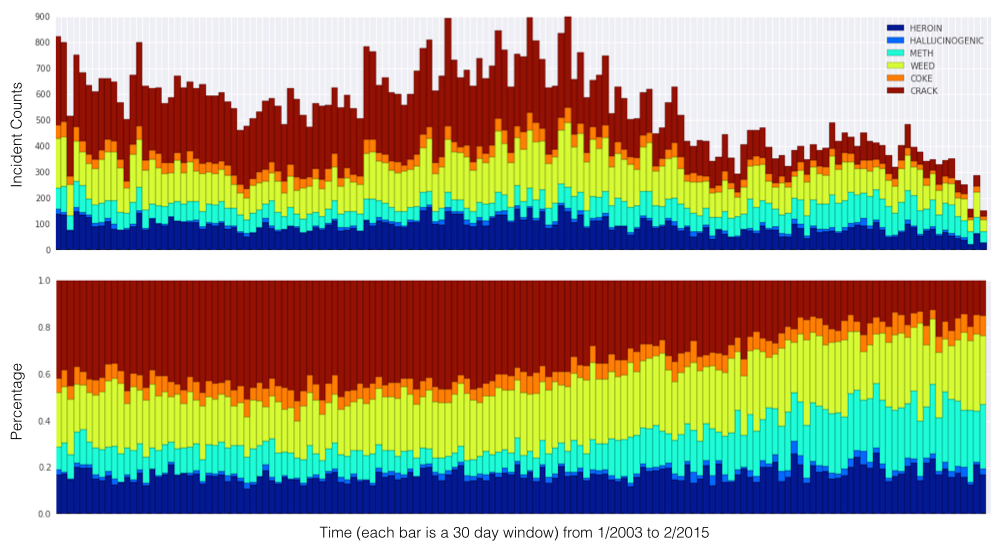
There's a lot to chew on, but I decided to drill down on the DRUG/NARCOTIC category. I grouped reported incidents based upon drug type (see notebook for details): the ordering in the below chart is HEROIN (blue, on the bottom), HALLUCINOGENIC, METH, MARIJUANA, COCAINE, CRACK (red, on top). I split the data into 30 day windows ranging from Jan, 2003 to Feb, 2015 (below). The top shows absolute incident counts per window and the bottom normalizes them to show a percentage.
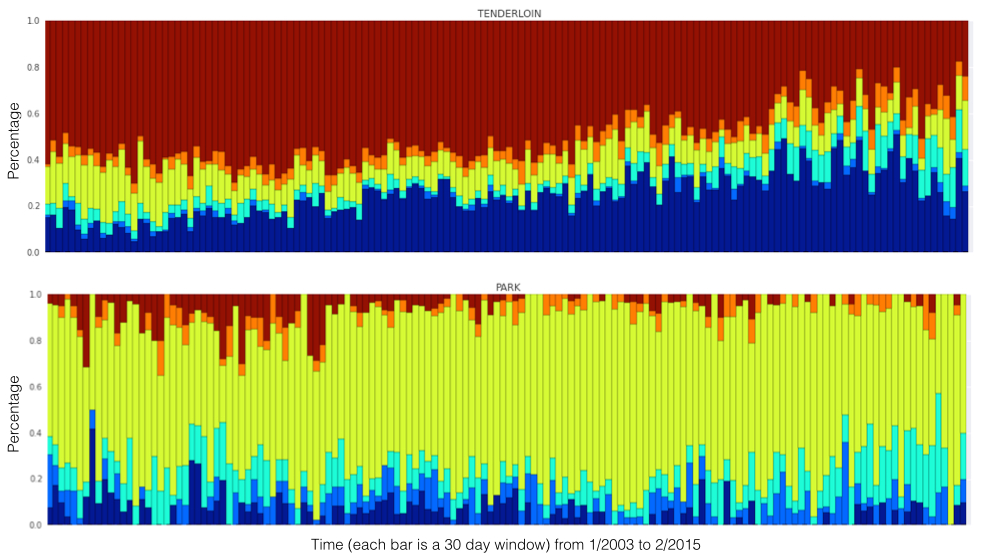
I looked at the drug distribution over time for each district. They look different. For example, TENDERLOIN (top) has been dominated by CRACK-related incidents (though this has changed in recent years). PARK (which is basically Haight-Ashbury) is mostly MARIJUANA-related incidents.
To examine that idea, I counted up incidents in each drug category for each district. Then, I just normalized the data so each district is a vector that sums to one. Then, I cluster this (shown below). Each column (district) sums to one, so we can compare the normalized "drug profile" of each district. For example, TARAVAL, PARK, and RICHMOND have mostly MARIJUANA-related incidents.
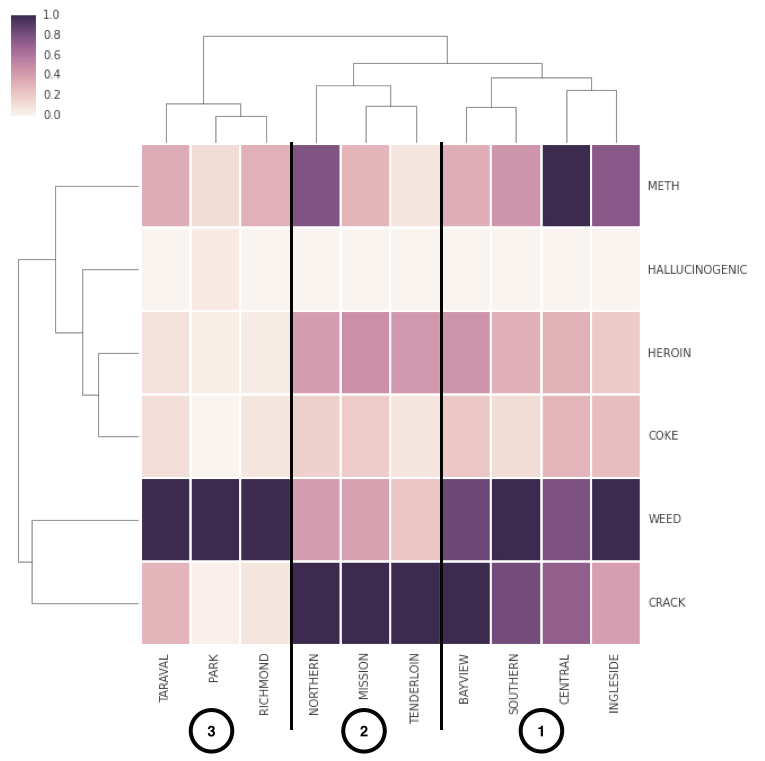
The three clusters that fall out seem to show that drug similarity mirrors the actual geography of the city from East to West (SFPD district map shown below). CRACK has historically (remember this data goes back 12 years!) dominated in NORTHERN, MISSION, and TENDERLON. BAYVIEW, SOUTHERN, CENTRAL, and INGLESIDE have been a mix of CRACK, METH, and MARIJUANA.
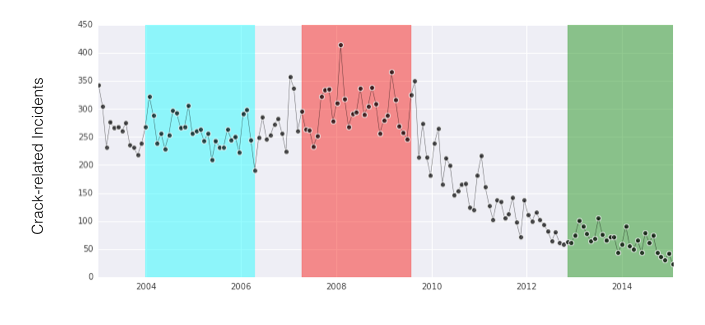
Because this data is timestamped, we can look at the temporal trends as well. The most striking trend I saw was the drop-off in CRACK-related incidents. Below is a timeseries of crack-related incidents with three equally long windows: the mean incident count in the red window is ~5-fold greater than the green. It looks like CRACK is becoming a smaller fraction of the drug landscape.
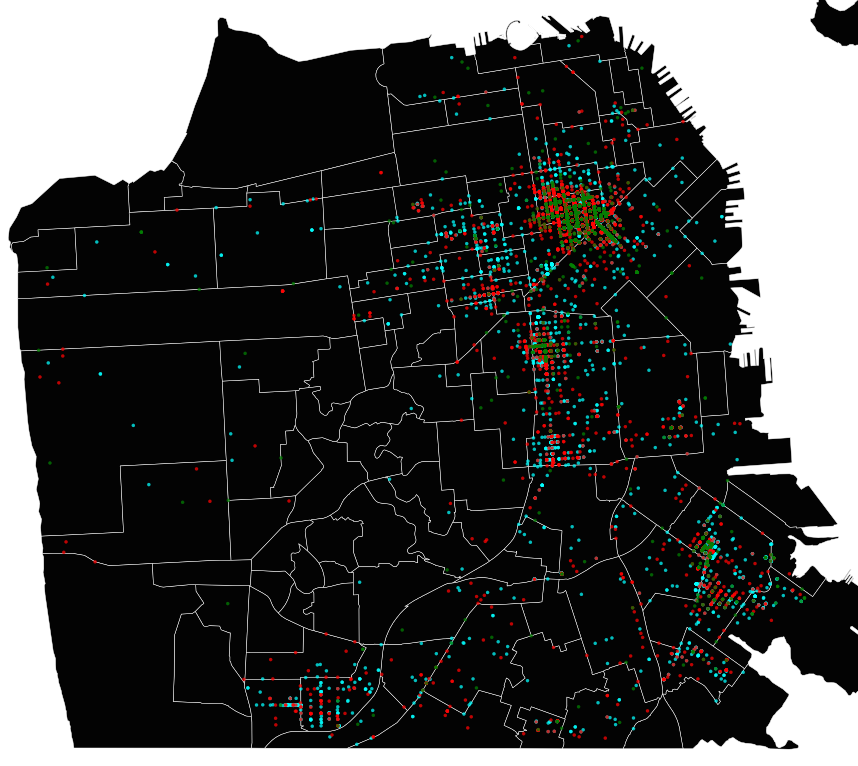
One way to examine this is to look at the raw GIS data associated with each report. I used python's Basemap library to plot the geo-tagged CRACK-related incidents in each interval on a map of SF. Based on the GIS data, CRACK's spatial footprint is getting small as the number of incidents drops.
If you go back to the data at top, the total number of drug-related incidents has been dropping. The mix is becoming more equally distributed between CRACK, MARIJUANA, and METH. But, there's a lot more to look at with this data. I invite folks to pull the notebook and explore for themselves!